
Research essay · Benchmark design
What Makes a Benchmark Worth Testing?
How case construction shapes scores, what a smaller test set preserves, and how to build evidence for the decisions we actually care about.
A question has kept coming back in our work on agent evaluation: if a small subset of cases tells us almost as much as the full benchmark, what were the other cases contributing?
That question reaches beyond saving inference calls. A thousand cases can repeat the same failure condition. A difficult suite can give weaker models an uninformative wall of zeros. Two models can obtain the same score while differing sharply in tool use, state tracking, recovery, and efficiency. A smaller suite may preserve the average while erasing precisely those differences.
The ranking example makes the problem tangible: A solves six out of ten cases; B solves five, but all five are difficult. Calling A “better” silently assumes that the ten successes have equal value. Where did that assumption come from? Often, from how many cases happened to be collected or generated.
Case construction is already part of the scoring rule. The production process determines which demands enter a benchmark and how much weight they receive. Compression may faithfully preserve that score without validating its weights or preserving the evidence needed for other evaluation goals.
The practical question is therefore: how do we build a set of cases that provides enough distinct, trustworthy evidence for a stated decision?
01 / What does a smaller test set preserve?
“Evaluate performance” can mean estimating a fixed benchmark’s mean, ordering nearby models, predicting utility on future work, or describing behavior across several goals. These are different statistical targets.
tinyBenchmarks showed that 100 selected examples could estimate scores on roughly 14,000 MMLU questions in its studied settings. Anchor Points similarly exploited relationships between item outcomes across models to reduce evaluation cost.16 17 But How Reliable is Language Model Micro-Benchmarking? found that strong aggregate prediction need not yield reliable comparisons between close models; in its settings, distinguishing such models could require up to about 250 examples, where random sampling became competitive.18
There are at least three reasons a benchmark can be compressible. Its cases may repeat the same challenge. The calibration models may have highly correlated abilities, so they respond similarly even to substantively different cases. Or the prediction target may simply be a mean: recovering one number is easier than recovering an entire behavior profile.
A useful thought experiment exposes the assumption. Two models can behave identically on a selected subset and differently everywhere else. Observations on the subset alone cannot tell them apart. Prediction becomes possible through assumptions about cross-item relationships, model populations, or task structure—and those assumptions need validation on new models.
| Intended use | Evidence the suite must retain | What a low score-estimation error leaves open |
|---|---|---|
| Estimate a fixed suite’s mean | Calibration on held-out models | Whether the original suite represents useful work |
| Compare nearby models | Paired differences and uncertainty | Whether a small gap has the correct sign |
| Diagnose several behaviors | Evidence for each goal and interpretable omissions | Whether a rare behavior disappeared during selection |
| Screen costly failures | Detection within relevant risk strata | Whether a high mean hides an important tail |
| Choose a deployment model | Utility on an independent workload | Whether the benchmark’s weights match actual needs |
Our development comparisons sharpened a related distinction: more failed cases did not always mean broader coverage of task families, and improvements on individual coverage measures did not imply a better overall trade-off. Those observations concern coverage and cost. Establishing score preservation requires a separate held-out score-estimation experiment.
Compression is evidence about a prediction problem. It becomes evidence about benchmark quality only after we specify what information the benchmark was meant to preserve.
02 / The hidden step: case counts become weights
Partition a benchmark into non-overlapping task families. Family g contains ng cases, with model m achieving a family mean smg. The ordinary mean is:
The factor ng/N is a weight. If a workflow is easy to generate or verify, producing more variants increases its influence on the score. A production convenience has become an evaluation preference.
Equal weighting is well motivated when cases are sampled from the target workload and successes have comparable value. Multiple cases can also improve precision within a family. The problem arises when convenience sampling or generation quotas quietly stand in for workload frequency, error cost, or a declared scientific priority.
Consider the ten-case example. A solves all five routine cases and one of five hard cases. B solves none of the routine cases and all five hard cases. Now copy each hard-case record once, leaving every model response unchanged.
| Suite composition | A | B | Leader by the ordinary mean |
|---|---|---|---|
| 5 routine + 5 hard | 6/10 = 60.0% | 5/10 = 50.0% | A |
| 5 routine + the same 5 hard records twice | 7/15 = 46.7% | 10/15 = 66.7% | B |
| Independent task demands added | 0 | 0 | Ranking still reverses |
This is a constructed counterexample: copying deterministic records adds no independent task evidence, but moves the hard-family weight from 1/2 to 2/3. Repeated stochastic executions are a different operation: they can reduce execution noise.
Let p be the hard-family weight in the intended use. Keeping the two family means fixed gives:
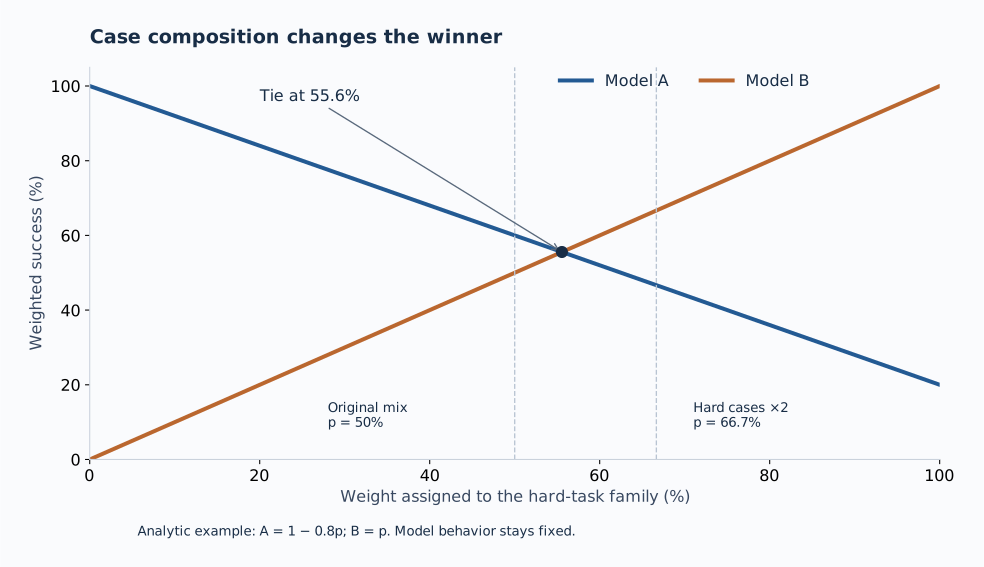
A has the higher observed utility below that threshold; B has the higher utility above it. Equivalently, if each hard-case success is worth r times a routine success, B wins when r > 1.25. Difficulty itself does not choose p or r. An obscure hard task can be unimportant, while a simple everyday task can matter enormously.
The Benchmark Lottery provides an empirical counterpart: choosing four of SuperGLUE’s eight tasks yields 70 combinations and six different first-place models.21 The important design question is what justifies the combination.
This suggests a concrete separation: set family weights from the intended use, and allocate cases within families to improve precision. More variants should not automatically create more importance. For overlapping goals, aggregation needs an explicit overlap rule rather than the partition formula above.
Would item response theory automatically put B ahead?
In the simplest Rasch model, it would not. With the same complete item set, fixed item difficulties, common discrimination, a single ability dimension, and local independence, the total number correct is sufficient for the ability parameter. The likelihood derivative is Σyi − Σσ(θ − bi), so the fitted ability increases with the total correct. A score of 5/10 does not overtake 6/10 just because the correct items look harder. More elaborate models change the assumptions; they still do not determine what a user should value.
03 / What frontier labs choose to measure
Model releases reveal which kinds of work their authors emphasize: engineering changes, professional deliverables, business automation, computer use, and scientific workflows. The following snapshot was checked on October 8, 2026.
| Release report | Selected benchmarks | Settings that define the comparison |
|---|---|---|
| OpenAI · GPT-6.1 Sol | DeepSWE 1.1; GDP.pdf; AutomationBench 1.0.6; OSWorld 2.0; Terminal-Bench Science 0.1 | OSWorld uses partial reward on a specified offline version; reasoning settings and per-task cost are reported.1 |
| Anthropic · Sonnet 5.5 | Terminal-Bench 4.0; FrontierCode 1.1; CursorBench 4.0; GDPval-AA v2.1; OSWorld 2.1 | OSWorld is partial credit; the highest reasoning setting does not win every task. FrontierCode: 46.2% at Max versus 52.1% at Xhigh.2 |
| Google DeepMind · Gemini 4 Argon | Engineering, knowledge work, science, long context, and computer use | The OSWorld offline evaluation specifies its version and 500-step budget, taking the best of three runs; self-evaluated and externally reported results are distinguished.3 |
My reading is that these selections serve three needs: relevance to product workflows, checkable outputs, and room to distinguish strong models at meaningful cost. That explains their usefulness as evaluation choices; the public reports do not disclose the complete internal selection process.
The benchmark name alone is insufficient to compare scores. Offline versus combined online/offline tasks, binary completion versus partial reward, one run versus best-of-three, and different tool permissions or agent frameworks define different measurements. A useful model claim is conditional on the task set, weights, framework, budget, and scorer version.
Adoption by a frontier lab establishes influence. To understand why a benchmark deserves confidence, we need to inspect its construction.
04 / What careful construction actually does
“Human-written,” “expert-designed,” and “algorithmically generated” describe production methods. Their value comes from the checks those methods enable.
| Benchmark | Construction evidence | The next question |
|---|---|---|
| GPQA, original | 448 expert-written science questions; expert accuracy 65%, non-expert accuracy 34% despite internet access.4 | How far does scientific question answering transfer to open-ended research? |
| DeepSWE | 113 tasks across 91 repositories and five languages; prompts, behavioral verifiers, reference solutions, and quality review.5 22 | Which engineering workload does the repository and task mix represent? |
| AutomationBench 1.0.6 | Six business functions, 47 tools, isolated company states, and positive and negative end-state assertions.6 | Do workflow quotas and interaction rules match the intended deployment? |
| AppWorld, original | Nine apps, 457 APIs, 750 tasks; programmatic state checks, including unwanted changes.7 | What does success reveal beyond completing the specified task? |
| ToolSandbox | Stateful tools, implicit dependencies, a simulated user, and intermediate/final milestones.8 | Do milestones accommodate valid alternative paths? |
| OSWorld 2.0 | 108 long-horizon tasks; end-state grading and trajectory-level challenge exposure.9 | Does challenge attribution remain reliable across frameworks and budgets? |
| HealthBench, original | 5,000 conversations; 262 doctors; 48,562 contextual rubric criteria.10 | How do rubric judgments relate to outcomes in the intended setting? |
DeepSWE makes the acceptance process concrete. Each task includes a prompt, verifier, and reference solution; checks focus on observable behavior, exercise alternative valid implementations, and include repeated runs for flakiness. That supports confidence in individual tasks. Representativeness is a separate question: active open-source repositories above a popularity threshold define a particular slice of engineering. A fixed framework controls conditions but does not establish equal suitability for every model; the native-framework comparison in the construction report used ten tasks.22
AutomationBench deliberately creates ambiguous records, stale information, and business rules embedded in messages. Its checks include required actions and prohibited side effects. In the official example, satisfying five of six assertions gives partial credit; full success requires all six. These choices make “update a record” materially different from “update the correct record and avoid damaging another.” The family quotas still need a rationale if the score is to estimate an actual workload.6
Algorithmic generation can make goals explicit too. AutoBencher optimizes dimensions including difficulty, topic importance, and novel performance patterns.11 The next step is to validate the connection between those construction goals and the judgment the resulting suite supports.
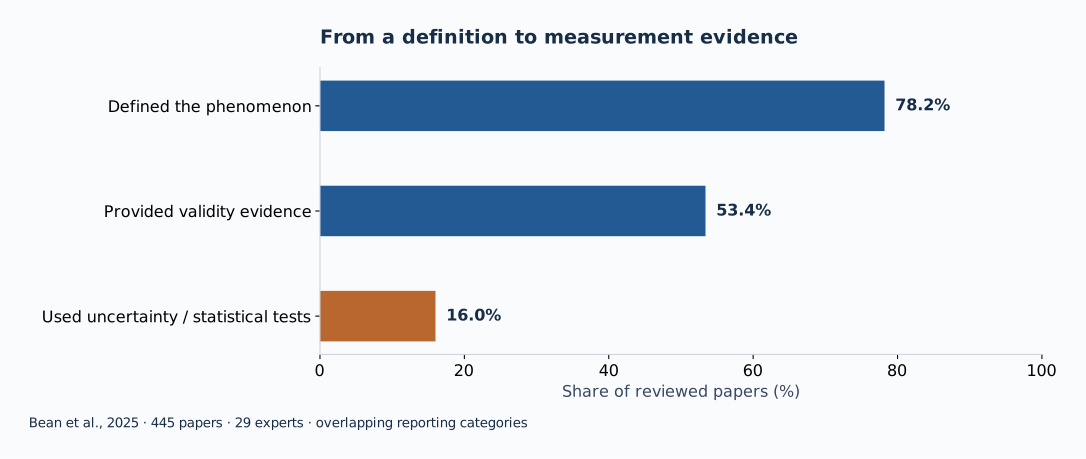
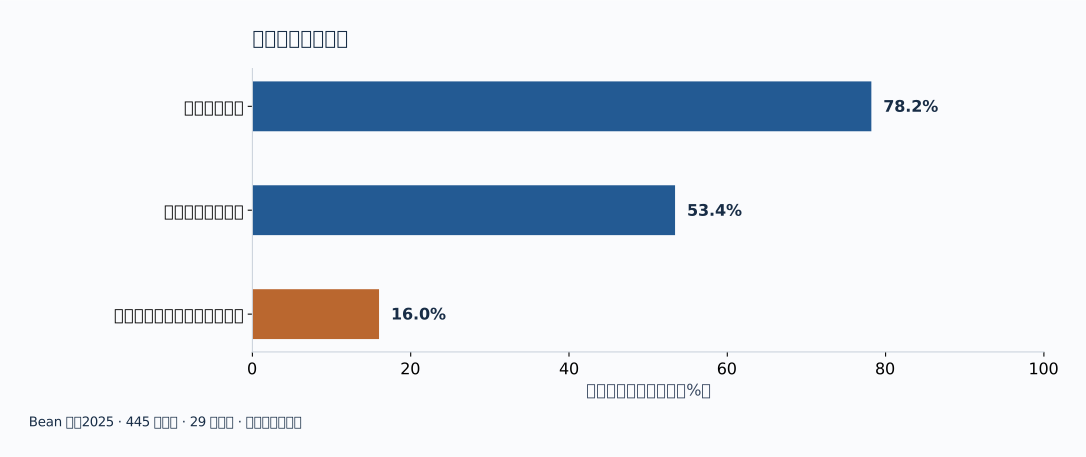
The wider evidence shows why this connection matters. In Measuring what Matters, 29 experts reviewed 445 benchmark papers.12
05 / A response is a clue; execution makes it interpretable
An agent task labeled “state tracking” can fail before the agent reaches the relevant state change. It can also succeed through a valid path that never requires remembering old feedback. In both cases, the task result is meaningful, but the label overstates the evidence for that specific capability.
OSWorld 2.0 already analyzes whether challenges were encountered, blocked, or left untested.9 This suggests a stronger way to use response examples: inspect the gap between the demand a case claims to test and the demand its execution actually exercises.
| Observed response | Competing explanation | A useful check |
|---|---|---|
| Removing old feedback changes nothing | The task did not need it; another source supplied it; the model was robust; the intervention failed | Inspect information access, verify the intervention, and distinguish valid alternative routes |
| Removing feedback sharply reduces success | The information mattered; or length, formatting, feasibility, or tool behavior also changed | Use a matched non-target edit and an information-restoration control |
| Many failures occur before a target challenge | An upstream bottleneck obscures the target | Report overall task outcomes alongside challenge-reach counts |
| Many cases respond in the same way | Repeated evidence; or correlated source models | Group by task family and test new model families |
| Partial score changes but completion does not | Local progress changed; the completion threshold did not | Read intermediate state and final delivery together |
A useful audit follows five links: what the task promises to measure; which information and states execution actually reaches; whether the intervention preserves a valid task; whether matched and restoration controls isolate the intended change; and whether the interpretation transfers to another model family.
Legal alternative paths matter. If a task permits either a batch query or several smaller queries, both should pass when they produce the right result. If a purported memory task can be solved entirely from the current request, that is evidence against its memory interpretation, not necessarily against its value as an end-to-end task.
The denominators matter too. Reporting only trajectories that reached the challenge can make a model that fails early look strong on the few surviving runs. Retain both the overall task denominator and the challenge-reach denominator, with missing execution or scoring evidence shown separately.
The research opportunity is to identify systematic mismatches between claimed demands and observed evidence, then show that repairing them improves an independent evaluation decision.
06 / The scorer is part of the experiment
A verifier can reject a correct implementation because it expects an unstated function name, or accept a wrong implementation because it checks only a convenient output. Passing a reference solution establishes one positive example. A stronger acceptance test also exercises valid alternatives and deliberately wrong solutions.
OpenAI’s audit of 138 selected difficult SWE-bench Verified tasks reported material test or specification issues in 59.4% of that audited set.13 This directly identifies a mechanism by which model scores can reflect verifier requirements that the task did not state.
![Figure 3 · Correct grading and metric meaning are two different questions. Left: the selected 138-task SWE audit, not the full 500-task suite; 40.6% is the remainder outside the listed issue categories. Right: OSWorld 2.0, Opus 4.8, maximum thinking, batched calls, 500 steps. Binary completion is 20.6%; mean partial reward is 54.8%. Sources: [13] and [9].](/assets/benchmark-measurement/scoring-en.svg)
The right panel illustrates a different issue: a perfectly implemented metric can still be misread. Partial credit measures progress toward delivery; binary completion measures whether the entire requirement was met. A partial score of 54.8% does not mean 54.8% of tasks were completed.
Recent protocol audits also test whether unintended strategies can earn high scores. One causal-discovery example raised a score from 0.018 to 0.639 by exploiting a variable-ordering pattern in the generator.14 An agent-safety audit found that labeling every example “unsafe” achieved F1 = 0.690 on R-Judge, exceeding five of 21 models that made differentiated judgments.15 These are concrete tests of the relationship between the scoring rule and the behavior it is meant to reward.
A benchmark acceptance suite should therefore contain both sides: behaviors that deserve credit and behaviors that should be rejected, including unintended side effects.
07 / Under a fixed budget, optimize the evidence you need
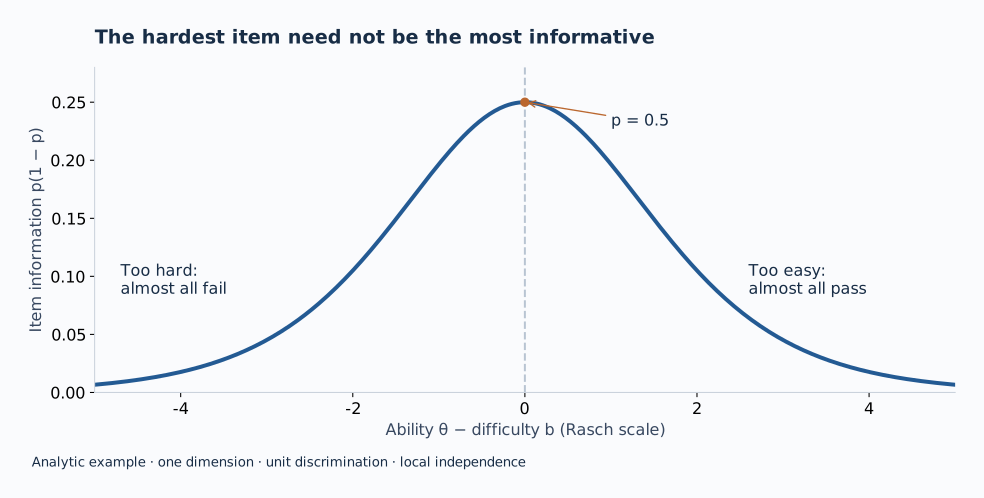
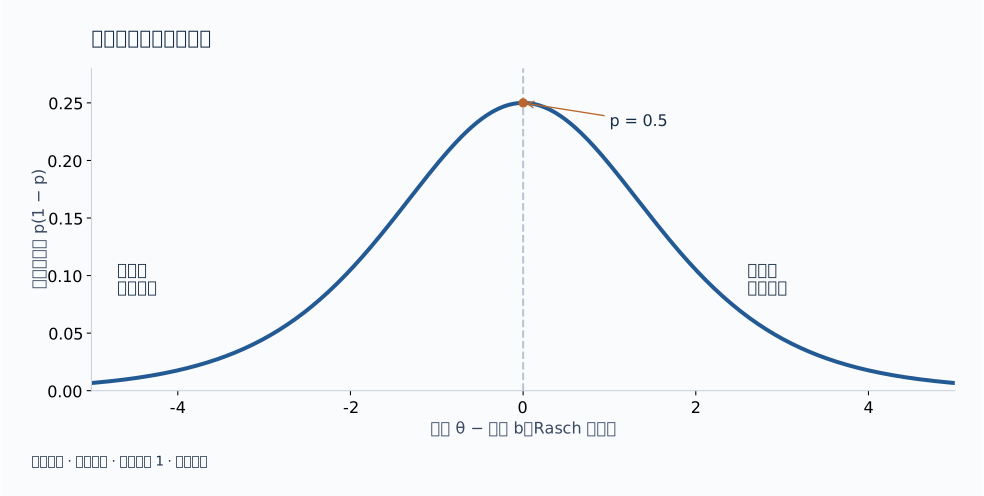
Harder cases help when current models are saturated. When almost every model fails, adding more difficult cases can produce little additional information about their differences. In a one-dimensional Rasch model with unit discrimination, item information is p(1 − p), maximized at p = 0.5.
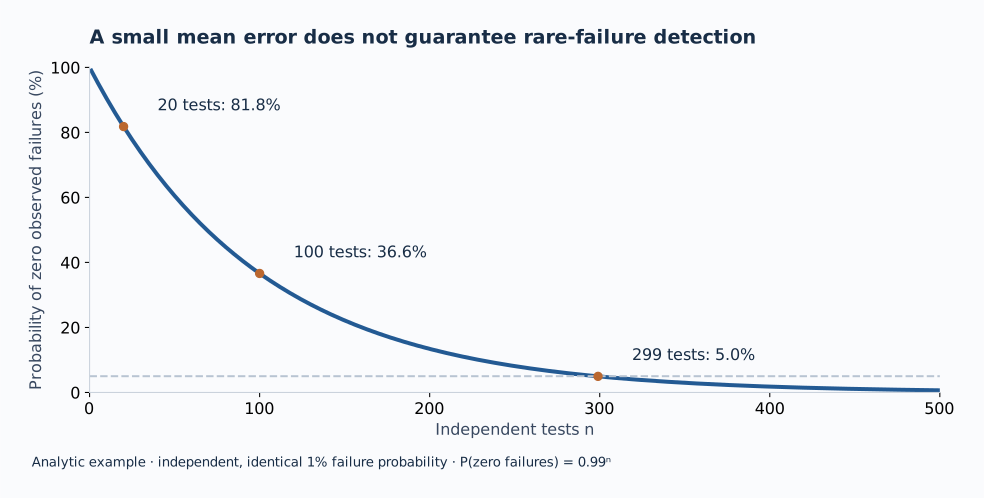
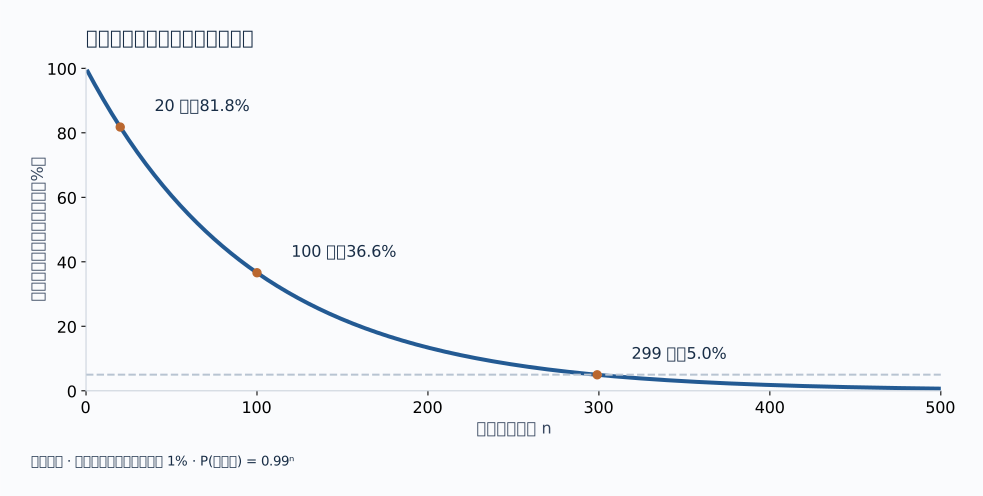
Rare-failure screening has another sample-size logic. With independent cases and a true failure probability of 1%, the probability of observing no failures in n trials is 0.99n.
For multi-goal agent evaluation, the useful output is often a vector: evidence for tool use, feedback retention, state updates, recovery, and quality-preserving efficiency. A high value on one axis does not fill a missing axis.
Coverage should have a defined unit. Let Ug be the set of audited behavioral conditions for goal g, and Eg(S) the conditions supported by acceptable execution evidence from selected cases S. A simple distinct-condition coverage is:
Here the difficult work is defining and auditing the conditions. If a hundred variants all support the same condition, they increase repeated observations, not the number of distinct conditions. Report those counts separately. An empty or unassessed Ug is unknown coverage, not 100%.
CheckList’s capability-by-test-type organization offers a useful precedent.20 Stateful agents add the requirement that the condition must actually occur during execution. Label coverage, tool-call coverage, and interpretable behavioral coverage consequently answer different questions.
A Pareto frontier can preserve trade-offs between coverage, redundancy, quality, and cost when no suite wins on all of them. Its meaning is conditional on the objectives and candidate pool. The objectives themselves need validation against the evaluation decision.
08 / Design a case, then design the suite
Consider an illustrative task: update the correct order using the approval valid at a specified time, notify its owner, and leave other orders unchanged. The environment contains two similarly named orders, an earlier approval, and a later change message.
Calling this a “memory and planning” task is only the beginning. Its construction should specify the following.
| Design layer | Concrete requirement | Acceptance check |
|---|---|---|
| Task contract | Entity identity, cutoff time, approval precedence, recipient, prohibited changes | All required information is available through allowed access |
| Initial state | Resolve the relationship between old approval and later message | Reset is reproducible; the conflict is real and resolvable |
| Valid solutions | Batch queries and sequential queries are both permitted | Alternative correct implementations pass |
| Wrong solutions | Wrong order, stale approval, missing notification, extra notification | Each targeted mistake is rejected |
| Challenge exposure | Which versions were read, and when? | Separate failure to reach the message from misuse after reading it |
| Response controls | Change only the intended information availability | Preserve feasibility; add matched edits and restoration |
| Place in the suite | Routine workload, rare risk, or deliberate challenge? | State its family, aggregation weight, and coverage unit |
This brings the interpretation closer to observable behavior: “the agent read the new approval but used the old state” is more actionable than “the agent lacks memory.” A task that supports only end-to-end completion can remain valuable without receiving a finer diagnostic label.
At suite level, the construction order matters. Start with the decision and its goals; identify independent task families and behavioral conditions; assign weights from the intended use; construct and accept instances; use model responses to detect gaps and redundancy; then freeze the suite for independent evaluation. If diagnostic challenges and representative workload samples are both useful, retain both groups with their own interpretation.
Dynamic collection, as in Dynabench, can discover new failures.19 Retaining an anchor set alongside versioned challenge sets helps distinguish model progress from changes to the measuring instrument.
09 / Three claims worth testing
The argument becomes a research program when it specifies results that could prove it wrong. These are the three hypotheses I would prioritize; they remain to be tested on the target agent tasks.
| Hypothesis | Experiment | Result that would weaken it |
|---|---|---|
| Production quotas materially affect comparisons | Hold model outcomes and independent task content fixed; vary family multiplicities; compare ordinary means with declared family weights | Rankings are stable, or the original frequencies already match the intended use |
| Score fidelity and goal fidelity can separate | Compare score-preserving subsets on independently audited goals, near-model comparisons, and new model families | Cheap score estimators retain all required evidence equally well |
| Response-assisted construction improves independent judgments | Compare accepted, response-informed suites with random, stratified, structural, difficulty, and score-estimation baselines under matched information and total cost | Simple baselines match it, gains stay within source models, or construction cost erases the benefit |
For each comparison, freeze the evaluation goals, selectors, acceptance rules, and tolerances before the target run. Use independent evidence for the final judgment: a separate workload for model selection, confirmed behavioral defects for diagnosis, or new task families for transfer. Reusing the selection response as the sole success metric would only show that the optimizer optimized its objective.
Cost accounting should include task construction, model probing, and recurring evaluation. Report both equal-case-count and equal-total-cost comparisons. A costly selection stage can be worthwhile when reused many times; the break-even point is part of the result.
A stopping rule should answer the original question about “how many cases are enough”: enough for which goals, with what uncertainty, on which population? Additional cases become unnecessary for a declared use when their marginal improvement in independent goal satisfaction or decision quality falls below a prespecified tolerance. A flat development score alone cannot establish that condition.
The question every additional case should answer
A benchmark does more than collect tasks. It distributes attention among demands, turns those demands into observable events, decides which events count as success, and aggregates the results into a judgment.
That is why compression, construction, scoring, and ranking belong in the same discussion. If production quotas determine the weights, a compact suite may reproduce an arbitrary preference very efficiently. If task labels are unsupported by execution, broad nominal coverage may hide missing evidence. If the scorer rewards the wrong behavior, adding cases can make a biased judgment look more precise.
The constructive alternative is to make each link inspectable: justify the mix, verify the case, observe the challenge, test the scorer, and validate the resulting decision. For every additional case, ask which judgment it improves—and what new evidence makes that improvement possible.
Sources and figure data
Web sources checked October 8, 2026. Figures 1, 4, and 5 are analytic examples; Figures 2 and 3 redraw public data. Data and sources.
- OpenAI. Introducing GPT-6.1 Sol. Model release report, 2026.
- Anthropic. Introducing Claude Sonnet 5.5. Model release report, 2026.
- Google DeepMind. Gemini 4 Argon: Model evaluation. Official evaluation methodology, 2026.
- Rein et al. GPQA: A Graduate-Level Google-Proof Q&A Benchmark. 2023 preprint; COLM 2024.
- Datacurve. DeepSWE v1.1. Official project, v1.1.
- Zapier. AutomationBench. Official project, leaderboard v1.0.6.
- Trivedi et al. AppWorld: A Controllable World of Apps and People for Benchmarking Interactive Coding Agents. ACL 2024; original 750-task release.
- Lu et al. ToolSandbox: A Stateful, Conversational, Interactive Evaluation Benchmark for LLM Tool Use Capabilities. Findings of NAACL 2025.
- Yuan et al. OSWorld 2.0: Benchmarking Computer Use Agents on Long-Horizon Real-World Tasks. 2026 preprint and project; configuration specified in Figure 3.
- Arora et al. HealthBench: Evaluating Large Language Models Towards Improved Human Health. 2025 preprint; original release.
- Li et al. AutoBencher: Towards Declarative Benchmark Construction. ICLR 2025.
- Bean et al. Measuring what Matters: Construct Validity in Large Language Model Benchmarks. NeurIPS 2025 Datasets and Benchmarks; Section 2.
- OpenAI. Why we no longer evaluate SWE-bench Verified. February 23, 2026; selected audit of 138 difficult tasks.
- Shao et al. Do Agent Benchmarks Measure Capability? Protocol Validity in the Age of Agentic AI. 2026 preprint; causal-discovery example in Case 6.
- Wang et al. Safety, or Just Capability? A Validity Audit of Agent-Safety Benchmarks. 2026 preprint.
- Maia Polo et al. tinyBenchmarks: evaluating LLMs with fewer examples. ICML 2024.
- Vivek et al. Anchor Points: Benchmarking Models with Much Fewer Examples. EACL 2024.
- Yauney, Warraich, and Swayamdipta. How Reliable is Language Model Micro-Benchmarking?. ICLR 2026.
- Kiela et al. Dynabench: Rethinking Benchmarking in NLP. NAACL 2021.
- Ribeiro et al. Beyond Accuracy: Behavioral Testing of NLP Models with CheckList. ACL 2020.
- Dehghani et al. The Benchmark Lottery. 2021 preprint.
- Datacurve. DeepSWE: Measuring frontier coding agents. Construction and quality-assurance methodology, May 26, 2026.
Research essay · Benchmark design
怎样设计一个真正有评测价值的 Benchmark?
题目构建如何进入分数,小题集究竟保住了什么,以及怎样为真正关心的判断设计证据。
在做 Agent 评测时,一个问题反复出现:如果只用一小部分 case,就能获得接近完整 benchmark 的信息,其余题目究竟贡献了什么?
这不只是节省模型调用的问题。一千道题可能反复检验同一种失败条件;很难的题集可能只让弱模型得到一排无法解释的零。两个模型总分相同,工具使用、状态跟踪、错误恢复和效率却可能截然不同。小题集可以保住平均分,同时丢掉恰好最值得了解的差别。
排名的例子让问题变得具体:A 答对十题中的六题;B 答对五题,但五题都是难题。称 A“更好”,暗含了十次成功价值相同的假设。这个假设从哪里来?很多时候,它来自各类题目恰好被收集或生成了多少道。
题目构建本身就是评分规则的一部分。 生产过程决定哪些需求进入 benchmark,以及它们占多大权重。压缩可以忠实保留这个分数,却没有验证权重是否合理,也没有保证其他评测目标所需的证据仍然存在。
因此,真正需要回答的是:怎样构建一组题,为事先明确的判断提供足够、可靠且不过度重复的证据?
01 / 小题集到底保住了什么?
“评估性能”可能指估计固定题集的平均分、区分相近模型、预测未来工作的效用,也可能指描述多个目标上的行为。这些是不同的统计对象。
tinyBenchmarks 在其研究设置中,用 100 道精选题估计约 14,000 道 MMLU 的成绩。Anchor Points 同样利用题目结果在模型之间的关联降低评测成本。16 17 但 How Reliable is Language Model Micro-Benchmarking? 发现,总体预测准确未必保证相近模型之间的可靠比较;在其设置中,区分这类模型可能需要多达约 250 道题,此时随机抽样也开始有竞争力。18
一个 benchmark 可压缩,至少有三种解释。题目可能反复测同一种挑战;校准模型的能力可能高度相关,因而对实质不同的题也表现相似;预测目标也可能只是平均数——恢复一个数,本来就比恢复整个行为画像容易。
一个思想实验可以揭示其中的假设。两个模型可以在选定子集上完全一致,在其余题上完全不同。只观察子集,无法区分它们。预测之所以可行,依赖的是跨题关系、模型群体或任务结构的假设,而这些假设需要在新模型上验证。
| 评测用途 | 题集必须保留的证据 | 总分估计误差小仍未回答的问题 |
|---|---|---|
| 估计固定题集平均分 | 留出模型上的校准 | 原题集是否代表有用的工作 |
| 区分相近模型 | 配对差异与不确定性 | 微小差距的方向是否正确 |
| 诊断多种行为 | 各目标证据与可解释的遗漏 | 罕见行为是否在选题中消失 |
| 筛查高代价失败 | 相关风险分层内的检出能力 | 高平均分是否掩盖重要尾部 |
| 选择部署模型 | 独立工作负载上的效用 | benchmark 权重是否符合实际需求 |
我们的开发比较也让一个相关区别变得清楚:更多失败 case 未必覆盖更多任务家族,单项覆盖指标提高也未必形成更好的综合取舍。这些观察涉及覆盖与成本;要证明总分保真,需要另做留出模型上的成绩估计实验。
压缩提供的是关于预测问题的证据。只有明确 benchmark 原本要保留什么信息,才能进一步讨论它对题集质量意味着什么。
02 / 隐藏的一步:题目数量变成了权重
把题集划分为不重叠的任务家族。家族 g 有 ng 道题,模型 m 在其中的平均成绩为 smg。通常的平均分就是:
其中 ng/N 就是权重。如果某种工作流容易生成或验证,多做一些变体就会提高它对总分的影响。生产上的便利,变成了评测中的偏好。
当题目来自目标工作负载的合理抽样,且各次成功价值相近时,等权有充分理由。同一家族的多道题也能提高组内估计精度。问题出在便利采样或生成配额悄悄替代了真实频率、错误代价或明确的研究重点。
回到十道题的例子。五道常规题,A 全对、B 全错;五道难题,A 对一道、B 全对。现在把每条难题记录复制一次,所有模型响应都保持不变。
| 题集组成 | A | B | 等权平均下的领先者 |
|---|---|---|---|
| 5 道常规题 + 5 道难题 | 6/10 = 60.0% | 5/10 = 50.0% | A |
| 5 道常规题 + 原来 5 条难题记录各出现两次 | 7/15 = 46.7% | 10/15 = 66.7% | B |
| 新增独立任务需求 | 0 | 0 | 排名仍然翻转 |
这是一个构造反例:复制确定性的记录没有增加独立任务证据,却把难题家族的权重从 1/2 提高到了 2/3。重复随机执行是另一回事,它可以减少执行噪声。
令目标用途中的难题家族权重为 p,保持两类题的组内均值不变,则:
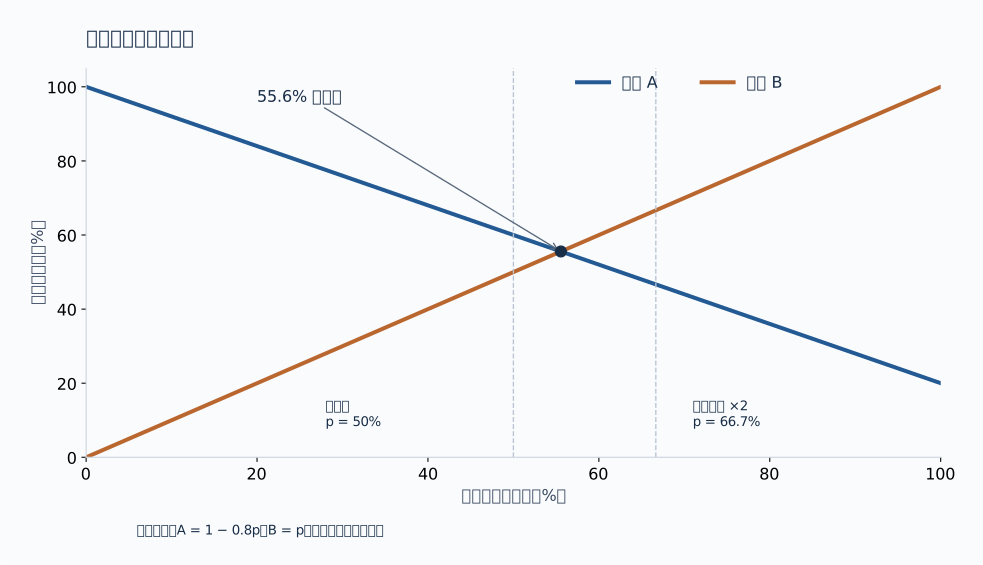
低于这一阈值,A 的观测效用更高;高于这一阈值,B 更高。等价地,如果每次难题成功的价值是常规题的 r 倍,r > 1.25 时 B 领先。难度本身不能决定 p 或 r。 冷门难题可能不重要,高频简单任务却可能极其重要。
The Benchmark Lottery 给出了实际研究中的对应现象:从 SuperGLUE 的八项任务中选四项,70 种组合产生了六个不同的第一名。21 设计上真正需要回答的是:为什么选择这种组合?
由此可以明确区分两件事:根据用途确定家族权重,根据估计精度分配家族内部的题量。更多变体不应自动制造更高的重要性。对于相互重叠的目标,聚合时还需要明确处理重叠,不能直接套用上面的分区公式。
题目反应理论会自动把 B 排到前面吗?
最简单的 Rasch 模型不会。在共同完整题集、固定题目难度、共同区分度、单维能力和局部独立的条件下,总正确数是能力参数的充分统计量。似然导数为 Σyi − Σσ(θ − bi),所以拟合能力随总正确数增加。5/10 不会因为答对的题看起来更难就超过 6/10。更复杂的模型会改变假设,但仍不能替使用者决定什么更重要。
03 / 头部公司选择测什么?
模型发布报告展示了作者重点关注哪些工作:工程修改、专业交付物、业务自动化、电脑操作和科学工作流。下面是截至 2026 年 10 月 8 日核对的代表性报告。
| 发布报告 | 使用的部分 benchmark | 决定比较含义的设置 |
|---|---|---|
| OpenAI · GPT-6.1 Sol | DeepSWE 1.1、GDP.pdf、AutomationBench 1.0.6、OSWorld 2.0、Terminal-Bench Science 0.1 | OSWorld 使用指定离线版本的部分得分;同时报告推理设置与每任务成本。1 |
| Anthropic · Sonnet 5.5 | Terminal-Bench 4.0、FrontierCode 1.1、CursorBench 4.0、GDPval-AA v2.1、OSWorld 2.1 | OSWorld 为部分得分;最高推理档位并非每项都最佳。FrontierCode 的 Max 为 46.2%,Xhigh 为 52.1%。2 |
| Google DeepMind · Gemini 4 Argon | 工程、知识工作、科学、长上下文与电脑操作 | OSWorld 离线评测明确版本和 500 步预算,三次运行取最高;区分自测与外部报告结果。3 |
我的理解是,这些选择服务于三种需要:贴近产品工作流、交付物可以检查、在有意义的成本下区分强模型。这解释了它们作为评测选择的用途;公开报告没有披露完整的内部筛选过程。
只有 benchmark 名称,不足以比较分数。离线任务与在线离线合并任务、完整完成率与部分得分、单次运行与三次取优、不同工具权限或 Agent 框架,定义的是不同测量。一个有用的模型结论,依赖于题集、权重、框架、预算和评分版本。
被头部公司采用说明实际影响力。要理解一个 benchmark 为什么值得信任,还需要进入它的构建过程。
04 / 认真构题,具体做了什么?
“人工编写”“专家设计”“算法生成”描述的是生产方式。它们的价值来自这种方式具体支持了哪些检查。
| Benchmark | 构建依据 | 下一层问题 |
|---|---|---|
| GPQA 原版 | 448 道专家科学题;专家准确率 65%,非专家可联网时为 34%。4 | 科学问答能向开放式研究迁移多远? |
| DeepSWE | 113 个任务、91 个仓库、五种语言;题面、行为判定器、参考解与质量审查。5 22 | 仓库与任务组合代表哪一种工程工作负载? |
| AutomationBench 1.0.6 | 六类业务职能、47 个工具、隔离公司状态,以及正负终态断言。6 | 工作流配额和交互规则是否对应目标部署? |
| AppWorld 原版 | 九个应用、457 个 API、750 个任务;程序化状态检查,包含不应发生的改动。7 | 成功除了说明完成指定任务,还能说明什么? |
| ToolSandbox | 有状态工具、隐含依赖、模拟用户、中间与最终里程碑。8 | 里程碑是否容纳合法替代路径? |
| OSWorld 2.0 | 108 个长流程任务;终态评分与轨迹层面的挑战触达分析。9 | 换框架或预算后,挑战归因是否仍然可靠? |
| HealthBench 原版 | 5,000 段对话、262 位医生、48,562 条情境评分标准。10 | rubric 判断怎样联系目标场景中的实际结果? |
DeepSWE 把验收过程写得很具体。每题包含题面、判定器和参考解;检查聚焦可观察行为,检验合法替代实现,并通过重复运行检查不稳定性。这些工作支持逐题质量。代表性则是另一层问题:超过关注度门槛的活跃开源仓库,对应特定工程工作范围。固定框架控制了条件,但没有自动证明它对每个模型同样适配;构建报告中的原生框架对照使用了十道题。22
AutomationBench 有意放入同名记录、过期信息,以及藏在消息中的业务规则。检查同时覆盖必须发生的操作和禁止出现的副作用。官方例子中,六项断言通过五项只获得部分分,全部通过才算完整成功。这让“更新了记录”与“更新了正确记录且没有破坏其他记录”成为实质不同的结果。如果要用总分估计真实工作负载,任务家族配额仍需要依据。6
算法生成也可以把目标显式化。AutoBencher 优化难度、主题重要性、新性能模式等维度。11 接下来需要验证的是:这些构建目标,与最终题集能够支持的判断之间有什么联系。
更大范围的证据说明了这种联系为何重要。Measuring what Matters 中,29 位专家审查了 445 篇 benchmark 论文。12
05 / 响应提供线索,执行使它可以解释
一个标为“状态跟踪”的 Agent 任务,可能在模型遇到相关状态变化之前就失败;也可能通过不需要保留旧反馈的合法路径成功。两种情况下任务结果都有意义,但标签可能夸大了它对指定能力提供的证据。
OSWorld 2.0 已经分析挑战被触达、被阻断或未测试的情况。9 这提示了一种更有力的响应分析:检查题目声称要测的需求,与执行中真正发生的需求之间的差距。
| 观察到的响应 | 竞争性解释 | 有用的检查 |
|---|---|---|
| 删除旧反馈后没有变化 | 任务不依赖它;别处仍有信息;模型稳健;干预未生效 | 检查信息读取,确认干预生效,识别合法替代路径 |
| 删除反馈后成功率明显下降 | 信息确实重要;也可能同时改变了长度、格式、可解性或工具行为 | 使用匹配的非目标改动,以及恢复信息的对照 |
| 大量失败发生在目标挑战之前 | 前置瓶颈遮住了目标 | 同时报告总体任务结果与挑战触达数 |
| 很多题出现相同响应 | 证据重复;也可能是源模型高度相关 | 按任务家族分组,并检验新模型家族 |
| 部分得分变化,完成率不变 | 局部进展变化,完整交付门槛未跨过 | 联合阅读中间状态与最终交付 |
有用的审计可以沿五个环节展开:任务承诺测什么;执行真正触达了哪些信息和状态;干预后任务是否仍然有效;匹配对照与恢复对照能否隔离目标变化;这套解释能否迁移到另一个模型家族。
合法替代路径很重要。任务允许批量查询或多次小查询时,只要达到正确结果,两者都应通过。如果一道声称测记忆的题仅靠当前请求就能解决,这削弱的是它的记忆解释,而不一定是它作为端到端任务的价值。
分母也很重要。只报告触达挑战的轨迹,可能让经常前序失败的模型在少数幸存执行上显得很强。应同时保留总体任务分母与挑战触达分母,并单列执行或评分证据缺失。
值得研究的,是找出“声称测到的需求”与“实际获得的证据”之间的系统性错配,再证明修复能够改善独立的评测判断。
06 / 评分器也是实验的一部分
判定器可能因为预设了题面没有要求的函数名而拒绝正确实现,也可能因为只检查一个方便的输出而接受错误实现。参考解能通过,只建立了一个正例。更完整的验收还需要合法替代解,以及刻意构造的错误解。
OpenAI 对 SWE-bench Verified 中选出的 138 道困难题进行审计,在该审计集合的 59.4% 中发现实质性的测试或说明问题。13 这直接指出了一种机制:模型成绩可能反映的是题面没有声明的判定器要求。
![图 3 · 判分正确与指标含义是两个问题。左:SWE 审计选择的 138 题,而非完整 500 题;40.6% 是所列问题之外的剩余比例。右:OSWorld 2.0,Opus 4.8、maximum thinking、批量调用、500 步;完整完成率 20.6%,平均部分得分 54.8%。来源:[13]、[9]。](/assets/benchmark-measurement/scoring-zh.svg)
右图说明另一类问题:即使指标实现完全正确,也可能被错误解读。部分得分衡量朝交付目标推进了多少;完整完成率衡量全部要求是否满足。54.8% 的部分得分,不等于 54.8% 的任务已经完成。
近期协议审计也检验了非预期策略能否拿到高分。一个因果发现案例利用生成器中的变量排列规律,将得分从 0.018 提高到 0.639。14 一项 Agent 安全审计发现,把 R-Judge 中所有例子都判为“不安全”,F1 可达 0.690,超过 21 个作出区分判断的模型中的五个。15 这些是在具体检验评分规则与预期奖励行为之间的关系。
因此,benchmark 的验收应同时包含值得给分的行为,以及应当拒绝的行为,包括不应发生的副作用。
07 / 固定预算下,优化真正需要的证据
当前模型接近满分时,提高难度有助于扩大区分空间;几乎所有模型都失败时,继续加难题可能很少增加关于模型差别的信息。在区分度为 1 的单维 Rasch 模型中,单题信息量为 p(1 − p),在 p = 0.5 时最大。
稀有失败筛查有另一套样本量逻辑。假设各题独立,真实失败概率为 1%,n 次测试中一次失败都看不到的概率是 0.99n。
对于多目标 Agent 评测,有用的输出往往是一个向量:工具使用、反馈保留、状态更新、错误恢复,以及保证质量前提下的效率。一维的高分不会补上另一维的证据缺失。
覆盖需要明确单位。令 Ug 为目标 g 下经过审计的行为条件集合,Eg(S) 为所选题集 S 通过合格执行证据支持的条件。一个简单的去重条件覆盖率是:
这里最难的工作是定义并审计行为条件。如果一百个变体都支持同一条件,它们增加的是重复观测,而非独立条件的数量。这两类计数应分别报告。Ug 为空或尚未审计时,覆盖是未知,而非 100%。
CheckList 按“能力维度 × 测试类型”组织行为测试,是一个有用的先例。20 有状态 Agent 又增加了一项要求:相关条件必须在执行中实际发生。因此,标签覆盖、工具调用覆盖、可解释的行为覆盖,回答的是不同问题。
当没有一套题在所有目标上都最佳时,Pareto 前沿可以保留覆盖、冗余、质量与成本之间的取舍。它的含义依赖目标定义和候选池;目标本身仍需要根据评测决策验证。
08 / 先设计一道题,再设计一组题
考虑一道示例任务:根据指定时刻有效的审批,更新正确订单,通知负责人,不改动其他订单。 环境中存在两个同名订单、一份较早审批,以及一条后来的变更消息。
把它称为“记忆与规划”任务只是开始。构建时还应明确以下内容。
| 设计层 | 具体要求 | 验收检查 |
|---|---|---|
| 任务合同 | 实体身份、截止时刻、审批优先级、收件人、禁止改动 | 必要信息可通过允许的访问方式获得 |
| 初始状态 | 明确旧审批与后续消息的关系 | 可复现重置;冲突真实存在且可解决 |
| 合法解 | 允许批量查询,也允许逐步查询 | 不同正确实现都能通过 |
| 错误解 | 错订单、过期审批、漏通知、多通知 | 逐项拒绝这些特定错误 |
| 挑战触达 | 读取了哪个版本,何时读取? | 区分未触达消息与读后误用 |
| 响应对照 | 只改变目标信息的可用性 | 保持可解,加入匹配改动与恢复对照 |
| 题集地位 | 常规工作、稀有风险,还是刻意挑战? | 明确家族、聚合权重和覆盖单位 |
这样,解释会更接近可观察行为:“Agent 读到了新审批,却使用了旧状态”,比“Agent 缺乏记忆”更便于检查和修复。只支持端到端完成判断的任务,也可以保留价值,无需贴上更细的诊断标签。
到了题集层面,构建顺序很重要。先明确决策与目标;识别独立任务家族和行为条件;根据用途设定权重;构造并验收实例;用模型响应检查缺口与冗余;最后冻结题集,进入独立评估。如果诊断挑战和代表性工作样本都有用途,就保留两组及各自的解释。
Dynabench 这样的动态收集可以发现新失败。19 同时保留锚定集与分版本挑战集,有助于区分模型进步和测量工具本身的变化。
09 / 三个值得检验的主张
当论证明确哪些结果会推翻它时,才能形成研究计划。下面是我会优先检验的三个假设;它们还需要在目标 Agent 任务上验证。
| 假设 | 实验 | 会削弱该假设的结果 |
| 生产配额实质影响模型比较 | 固定模型结果与独立任务内容,改变家族重复倍率;比较普通均值与明确家族权重 | 排名本来就稳定,或原频率已符合用途 |
| 总分保真与目标保真可以分离 | 在独立审计的目标、相近模型比较和新模型家族上检查保分子集 | 低成本成绩估计法同样保住全部必要证据 |
| 响应辅助构建改善独立判断 | 在匹配信息与总成本下,与随机、分层、结构、难度、成绩估计基线比较 | 简单基线持平、收益仅限源模型,或构建成本抵消收益 |
每次比较,都应在目标运行前冻结评测目标、选题规则、验收规则和容忍度。最终判断使用独立证据:模型选择用另一份工作负载,诊断用已确认的行为缺陷,迁移用新的任务家族。如果只用选题时的响应作为成功指标,就只是证明优化器优化了自己的目标。
成本核算应包含构题、模型探测与后续评测,同时报告相同题数和相同总成本的比较。昂贵的选题阶段在多次复用后可能值得,收支平衡点也是结果的一部分。
停止增题的规则,应回答最初的“多少题才够”:对什么目标、允许多大不确定性、面向哪个群体才够?当新增题对独立需求满足或决策质量的边际改善低于预先设定的容忍度时,才能说它对声明用途已不再必要。开发曲线变平,本身不足以建立这个结论。
每增加一道题,都应该回答的问题
一个 benchmark 所做的,不只是收集任务。它在不同需求之间分配注意力,把需求转成可观察事件,决定哪些事件算成功,再把结果聚合为判断。
因此,压缩、构建、评分与排名需要放在同一个讨论中。如果生产配额决定权重,小题集可能只是高效复现了一种缺乏依据的偏好;如果任务标签缺少执行支持,广泛的名义覆盖可能掩盖证据缺口;如果评分器奖励了错误行为,增加题量可能让有偏的判断看起来更加精确。
可执行的改进,是让每个环节都能检查:解释题集组合,验收任务,观察挑战,检验评分器,验证最终决策。每增加一道题,都应追问:它改善了哪一个判断,又提供了什么新的证据,使这种改善成为可能?
资料与图表数据
网页资料查阅于 2026 年 10 月 8 日。图 1、4、5 为解析例子,图 2、3 为公开数据重绘。数据与来源。
- OpenAI. Introducing GPT-6.1 Sol. 模型发布报告,2026;查阅于2026-10-08。
- Anthropic. Introducing Claude Sonnet 5.5. 模型发布报告,2026;查阅于2026-10-08。
- Google DeepMind. Gemini 4 Argon: Model evaluation. 官方方法说明,2026。
- Rein et al. GPQA: A Graduate-Level Google-Proof Q&A Benchmark. 2023预印本,COLM 2024。
- Datacurve. DeepSWE v1.1. 官方项目与构建说明;查阅于2026-10-08。
- Zapier. AutomationBench. 官方项目,榜单版本1.0.6;查阅于2026-10-08。
- Trivedi et al. AppWorld: A Controllable World of Apps and People for Benchmarking Interactive Coding Agents. ACL 2024。本文使用原论文750题口径。
- Lu et al. ToolSandbox: A Stateful, Conversational, Interactive Evaluation Benchmark for LLM Tool Use Capabilities. Findings of NAACL 2025。
- Yuan et al. OSWorld 2.0: Benchmarking Computer Use Agents on Long-Horizon Real-World Tasks. 2026预印本与项目页;图3为项目页所列配置,查阅于2026-10-08。
- Arora et al. HealthBench: Evaluating Large Language Models Towards Improved Human Health. 2025预印本,原版数据。
- Li et al. AutoBencher: Towards Declarative Benchmark Construction. ICLR 2025。
- Bean et al. Measuring what Matters: Construct Validity in Large Language Model Benchmarks. NeurIPS 2025 Datasets and Benchmarks。图2使用第2节结果。
- OpenAI. Why we no longer evaluate SWE-bench Verified. 2026-02-23;138道困难题的选择性审计。
- Shao et al. Do Agent Benchmarks Measure Capability? Protocol Validity in the Age of Agentic AI. 2026预印本。因果发现实例见Case 6。
- Wang et al. Safety, or Just Capability? A Validity Audit of Agent-Safety Benchmarks. 2026预印本。
- Maia Polo et al. tinyBenchmarks: evaluating LLMs with fewer examples. ICML 2024。
- Vivek et al. Anchor Points: Benchmarking Models with Much Fewer Examples. EACL 2024。
- Yauney, Warraich, and Swayamdipta. How Reliable is Language Model Micro-Benchmarking?. ICLR 2026。
- Kiela et al. Dynabench: Rethinking Benchmarking in NLP. NAACL 2021。
- Ribeiro et al. Beyond Accuracy: Behavioral Testing of NLP Models with CheckList. ACL 2020。
- Dehghani et al. The Benchmark Lottery. 2021预印本。
- Datacurve. DeepSWE: Measuring frontier coding agents. 构建与质量验收方法,2026-05-26。